
Now that I have your attention, let’s talk about infographics!
Infographics combine graphics and minimal text to highlight key information.
When you have a lot of information to share with your audience, using infographics provides a great way to keep your audience engaged while keeping the content fun.
Most importantly, infographics are sharable on all digital platforms including websites, emails, and social platforms, making your content more likely to be read. And for an additional bonus: Infographics improve your Search Engine Optimization performance through backlinking and increasing your Google ranking.
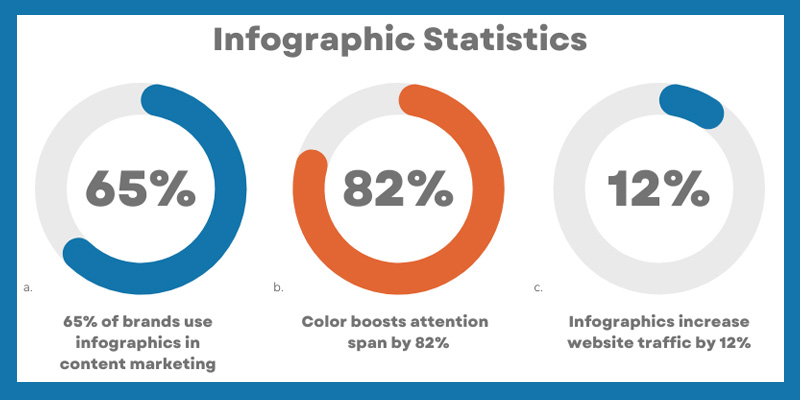
Look at the infographic that I created above. It’s easy; it took me 10 minutes to design, and look at the impact.
So, how do you create effective infographics?
-
- Make text concise
- Include icons and pops of color
- Create a balance of visuals and text
- Summarize statistics with charts or graphs
If you have complex information to share or need help getting people to actually read your content, perhaps you should consider using infographics.
It’s fun, easy and gets results. We can help.