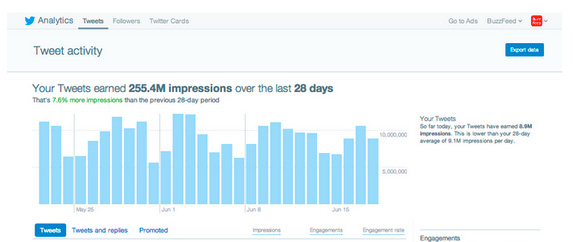
A breakdown of everything you need to know about Twitter’s new dashboard!

Twitter is catching up to Facebook’s Insights with its refreshed engagement tracking dashboard. Need richer data? Want to know which tweets are going viral or how far they’re reaching? Keep reading…
According to Twitter’s latest blog post, until just recently, “a Tweet’s impact was measured largely by the number of Retweets and favorites it received.” So what new changes have taken effect to help you understand your Twitter’s audience? Here’s our breakdown:
- It’s all about impressions
Twitter’s dashboard now offers you the power to view impressions, or how many people have viewed your Tweets. The dashboard is also optimized to track impressions on Android and iOS apps, along with Twitter.com, too.What you can do with this information: Analyze the types of posts that receive the highest and lowest impressions, then create new content that fits what your followers (or those who view your Tweets) like.
- Engagement has evolved
Want to see who’s Retweeted or favorited your posts? Click on any Tweet to view those metrics in detail. You can also track how many people have clicked on any links or hashtags you’ve Tweeted, too.How does this help? Other than the basics, you can track the traffic Twitter is directing to your website, which you should be linking often.
- You can print out monthly analytic reports
Who doesn’t love an Excel spreadsheet? We sure do and so does Twitter. Now you can print out reports for up to 3200 Tweets. We recommend creating a monthly schedule (i.e., the first of every month) to review and analyze these reports and metrics to effectively measure growth and what needs to be changed.
Go ahead. Dive into your Twitter account and take a look today. Every business needs KPIs (key performance indicators) and, just like Facebook, the use of social media management tools can certainly help your business grow.
If you’re stumped, don’t sweat it—we can help.
Just send us an e-mail today: info@counterintuity.com
